Decoding Carbonyl IR Spectra: A Quick Guide

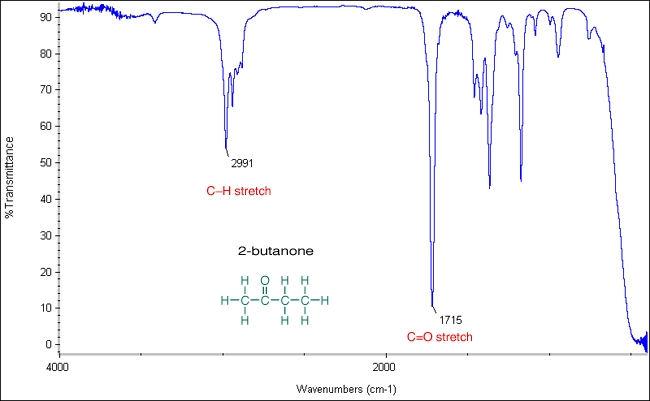
Infrared (IR) spectroscopy is a powerful tool for identifying functional groups in organic compounds, and carbonyl groups are among the most important to recognize. The carbonyl stretch, typically appearing between 1600–1900 cm⁻¹, is a key feature in IR spectra. Understanding how to decode this region can provide valuable insights into a molecule's structure. Whether you're a student, researcher, or industry professional, mastering carbonyl IR spectra is essential for accurate analysis. (IR spectroscopy, carbonyl groups, functional group identification)
Understanding the Carbonyl Stretch

The carbonyl stretch arises from the vibration of the C=O bond. Its position in the IR spectrum depends on factors like bond strength, electronegativity, and molecular environment. For example, aldehydes and ketones typically show a strong carbonyl stretch around 1700–1750 cm⁻¹, while carboxylic acids appear at 1700–1725 cm⁻¹. (carbonyl stretch, C=O bond, aldehydes, ketones, carboxylic acids)
Factors Affecting Carbonyl Stretch
- Electronegativity: Higher electronegativity shifts the peak to higher wavenumbers.
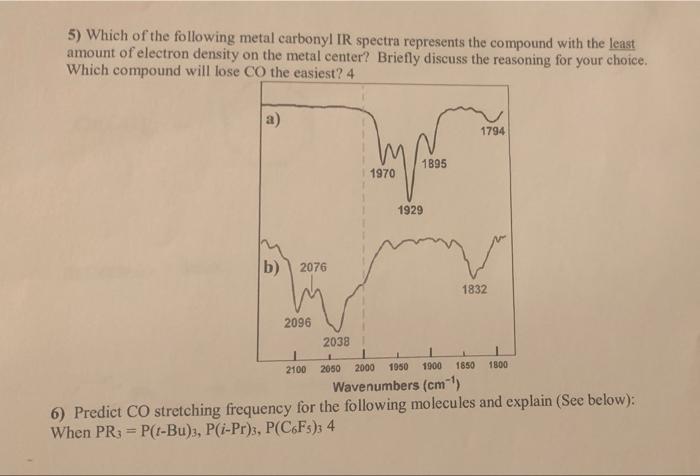
- Hydrogen bonding: Broadens the peak and shifts it to lower wavenumbers.
- Conjugation: Lowers the wavenumber due to delocalization of electrons.
📌 Note: Always consider the molecular environment when interpreting carbonyl stretches.
Key Carbonyl Compounds and Their IR Signatures

Different carbonyl-containing compounds exhibit distinct IR patterns. Here’s a quick reference table for common carbonyl groups:
| Compound | Carbonyl Stretch (cm⁻¹) | Key Features |
|---|---|---|
| Aldehydes | 1720–1740 | Strong, sharp peak |
| Ketones | 1700–1720 | Strong, sharp peak |
| Carboxylic Acids | 1700–1725 | Broad peak due to hydrogen bonding |
| Esters | 1730–1750 | Strong, sharp peak |

(aldehydes, ketones, carboxylic acids, esters, IR signatures)
Checklist for Decoding Carbonyl IR Spectra
- Identify the carbonyl stretch region (1600–1900 cm⁻¹).
- Note the peak shape (sharp, broad) and intensity (strong, weak).
- Consider molecular environment and functional group context.
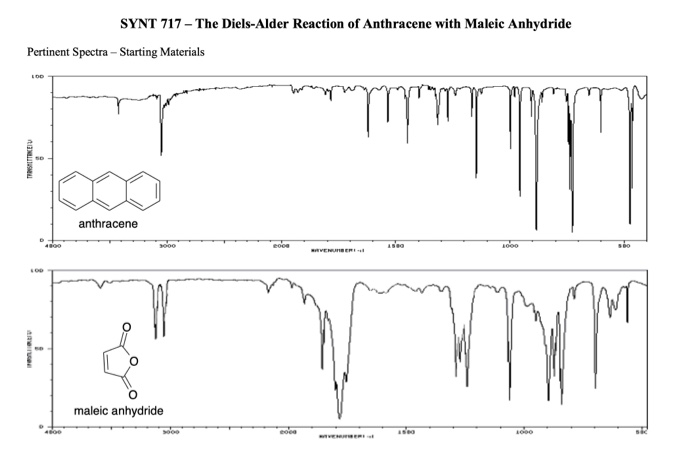
- Compare with known spectra for confirmation.
Decoding carbonyl IR spectra is a critical skill in organic chemistry and analytical chemistry. By understanding the factors influencing the carbonyl stretch and recognizing key signatures, you can confidently identify carbonyl-containing compounds. Use the checklist provided to streamline your analysis and enhance accuracy. (organic chemistry, analytical chemistry, carbonyl identification)
What is the typical range for a carbonyl stretch in IR spectroscopy?
+The carbonyl stretch typically appears between 1600–1900 cm⁻¹, with specific ranges varying by compound type.
How does hydrogen bonding affect the carbonyl stretch?
+Hydrogen bonding broadens the carbonyl stretch peak and shifts it to lower wavenumbers, often observed in carboxylic acids.
Can conjugation impact the carbonyl stretch position?
+Yes, conjugation lowers the wavenumber of the carbonyl stretch due to electron delocalization.


